You can now display your Microsoft PowerBI reports and dashboards directly in SUIVI, within a Dashboard view or a Portal.
The goal: to bring KPIs closer to the spaces where teams actually manage their activity.
Performance review, project tracking, quality, production, support, finance… your PowerBI indicators can now be viewed in the same place as your actions, decisions, and team rituals.
Some possible uses
-
track the KPIs of an activity in a management board,
-
integrate quality, production, or support indicators into the team’s space,
-
display key indicators on a portal’s home page.
The widget respects Microsoft / PowerBI rights: depending on the chosen mode, the display depends on the rights of the logged-in user or integrated access to the board.
To get started
Activation and use are done in two steps:
-
Configure the PowerBI connector
https://doc.suivi.work/fr/articles/1779969455-activer-le-connecteur-microsoft-powerbi
-
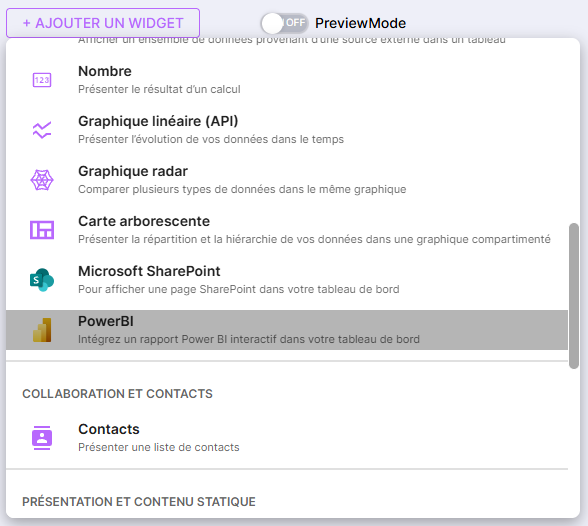
Add and use the PowerBI widget in SUIVI
https://doc.suivi.work/fr/articles/1779987314-utiliser-le-connecteur-microsoft-powerbi
With this connector, your reports come directly into your SUIVI management spaces, to decide faster and with less dispersion.