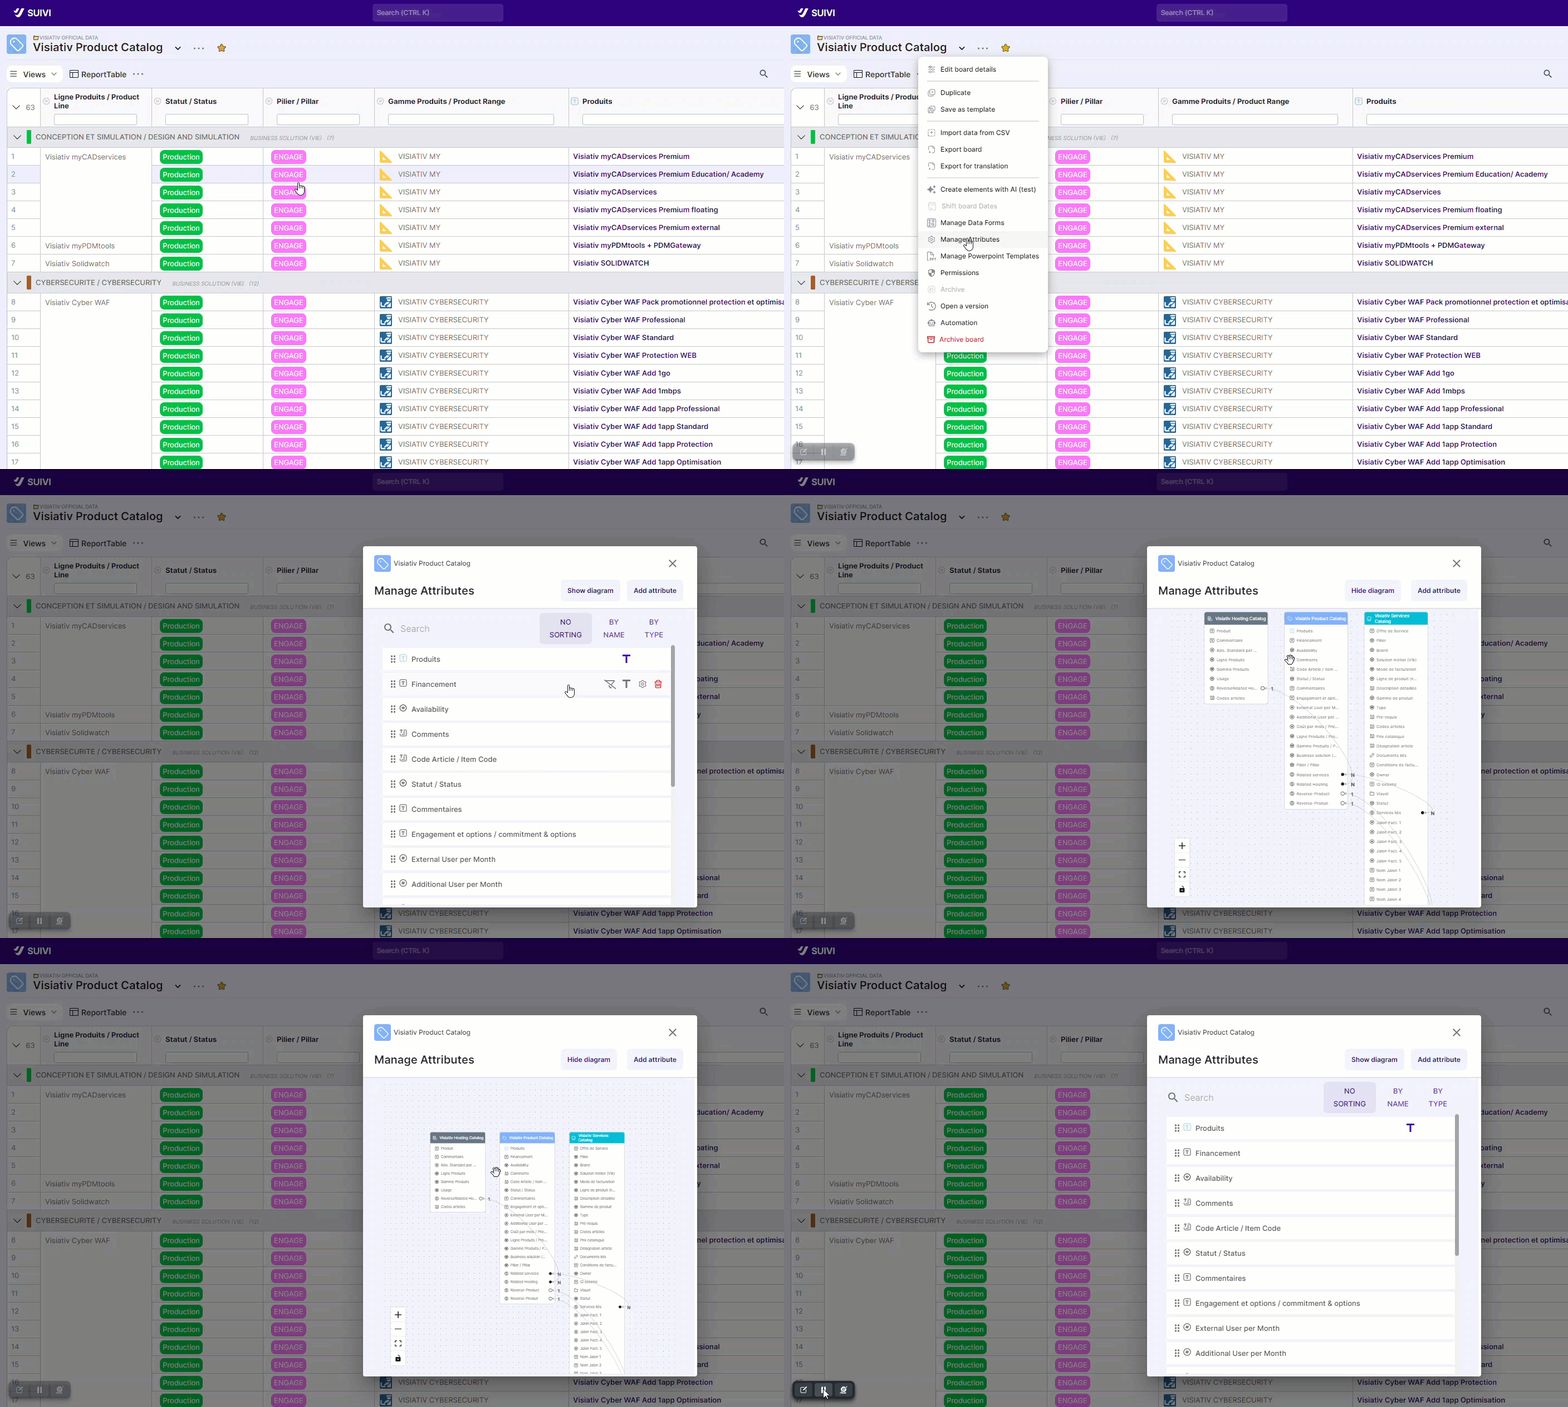
You probably know the attribute management window, this practical space that allows you to create, organize, and modify all the attributes of your board.
But do you know the interactive diagram? It represents the model of your board and linked boards if you use relationships.
Thanks to this view, you can visualize at a glance the interconnections and the complete structure of your data!